Tutorial#
See also
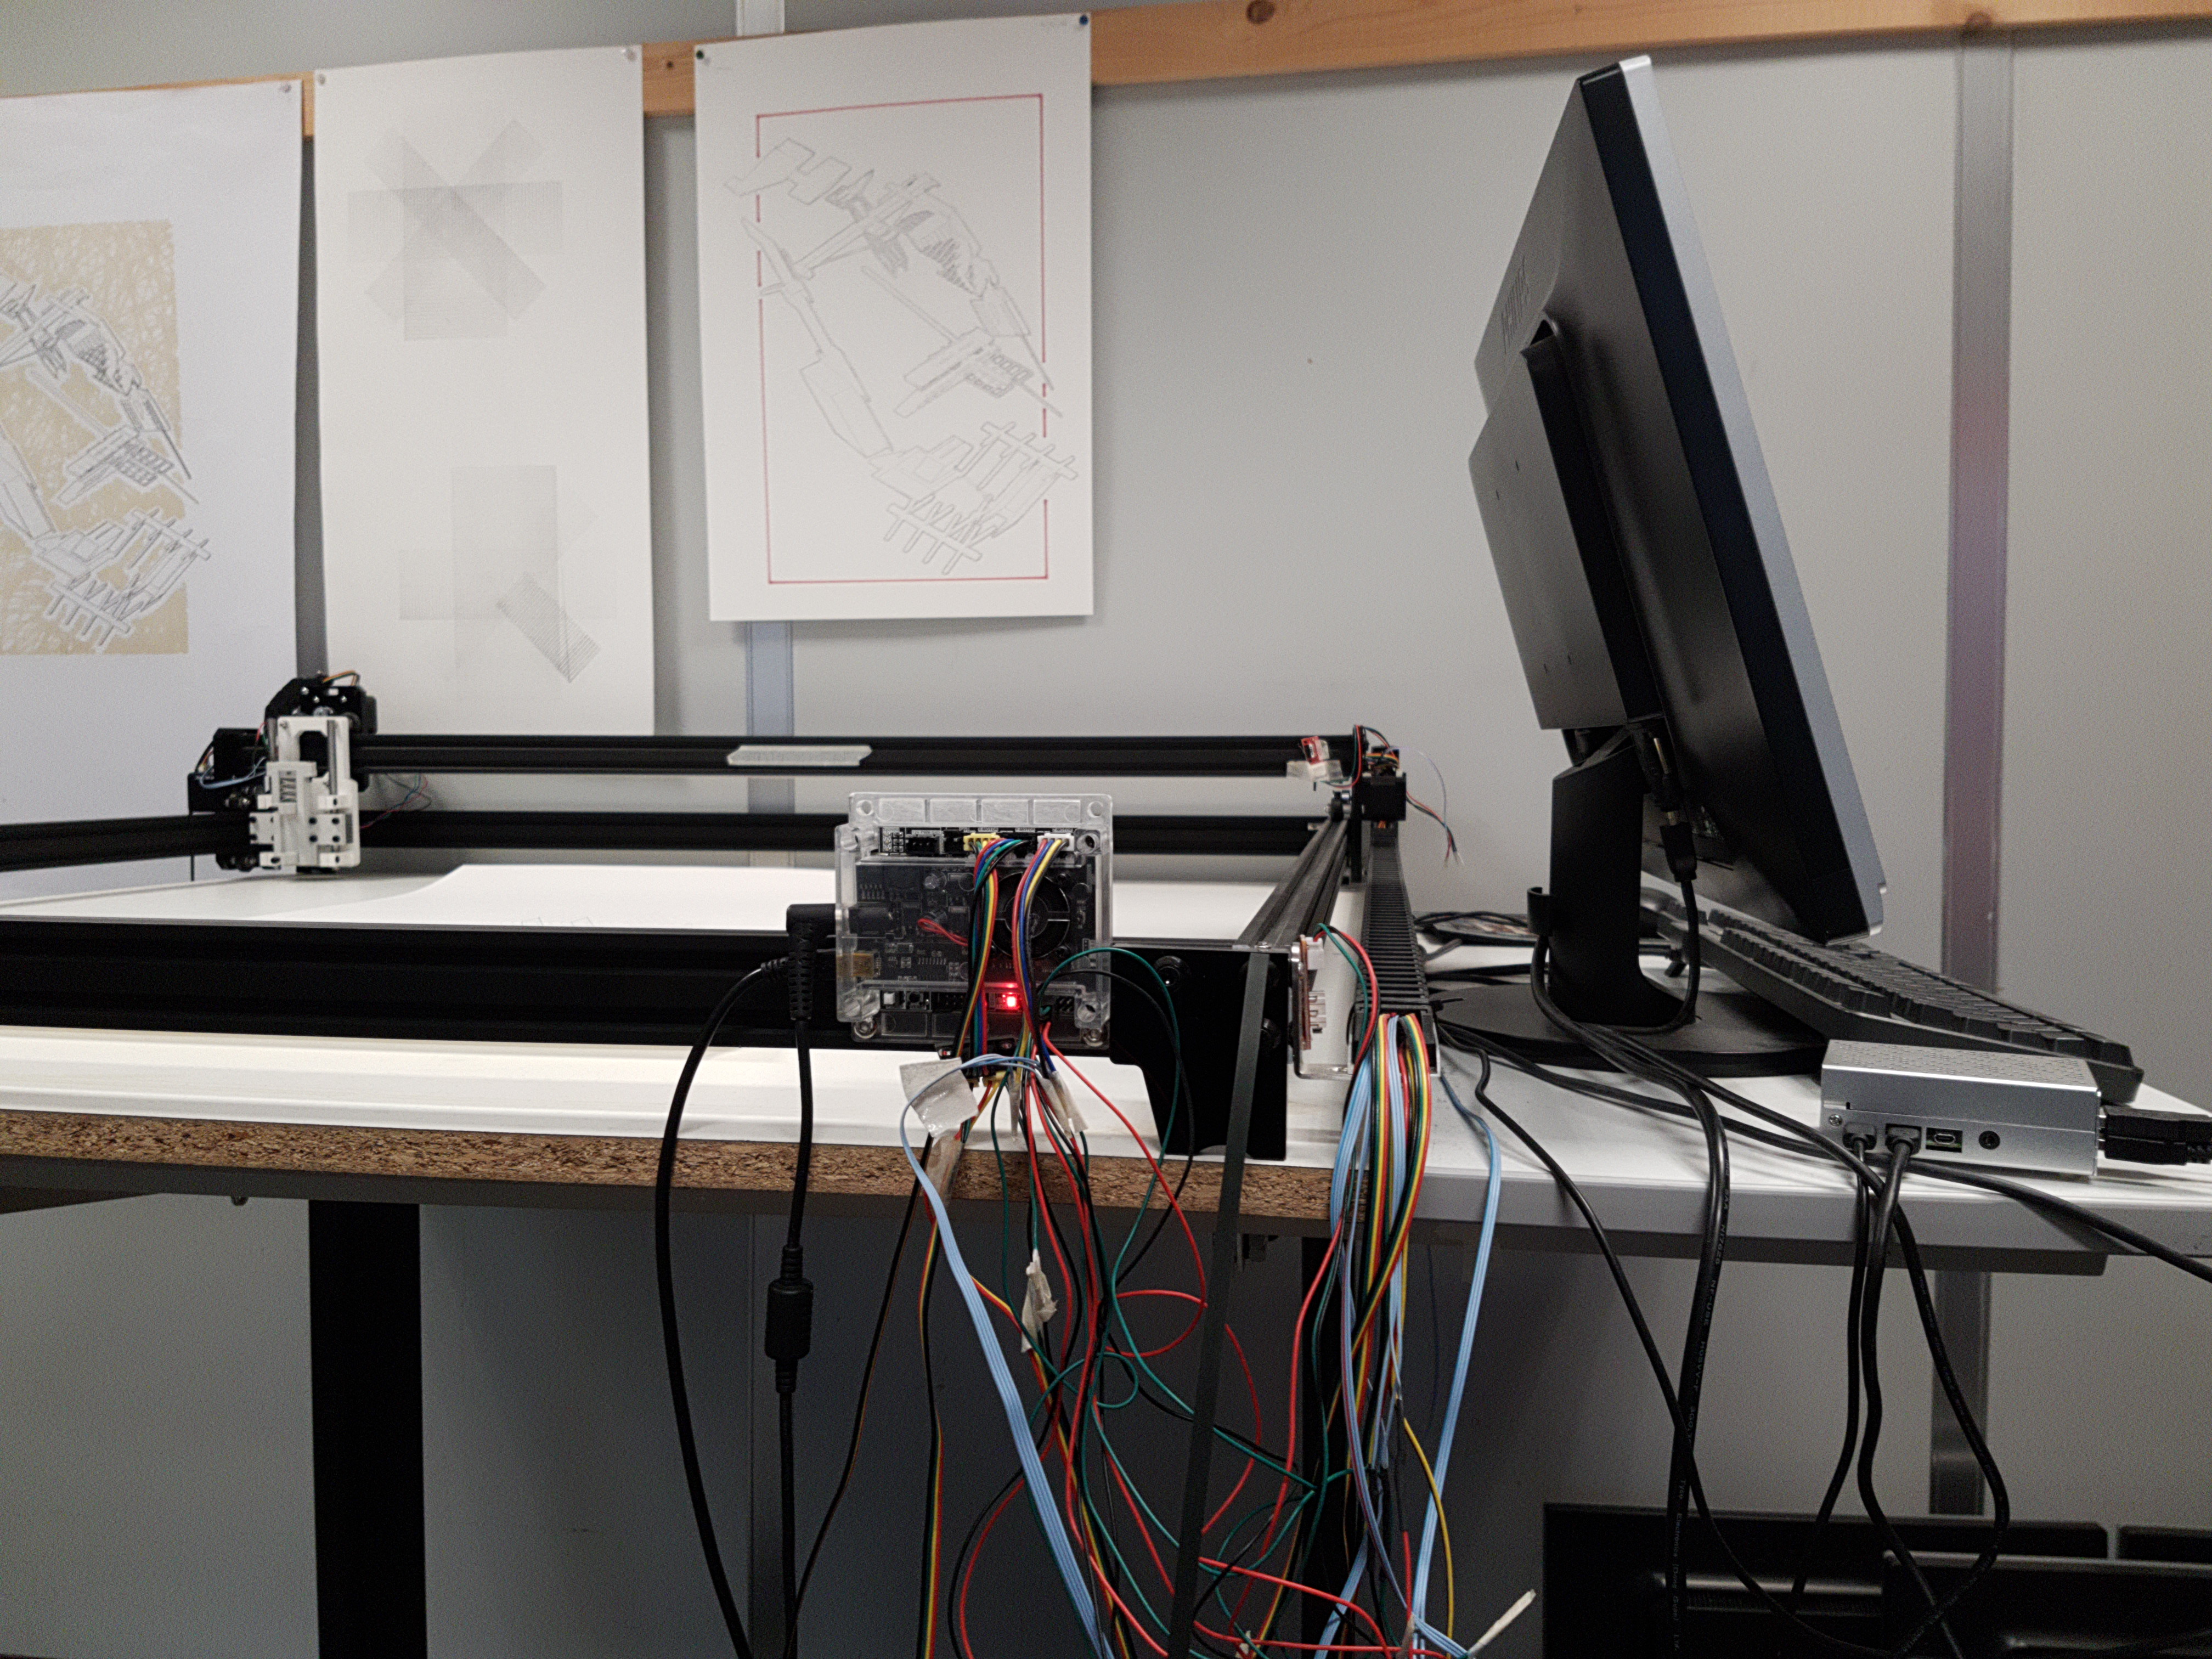
This section is about plotting a single SVG file. To find instructions about building a custom pen plotter and installing the svg2plot interface, head to the Reference Guide.
Follow this tutorial - a step by step guide - to learn how to plot a single SVG (acronym for “Scalable Vector Graphics”) file. The first step is to get the machine powered up and running. The second step is to select and convert an SVG file to a gcode file with the help of the svg2plot interface. The third step is to set up the plotter with a drawing tool and to stream the generated gcode file to the plotter.
Note
No installation is needed to follow this tutorial on the plotter at the AlICe laboratory.